Strategy Tester Report
AlpariUK-Demo (Build 225)
| Symbol | USDJPY (US Dollar vs Japanese Yen) | ||||
| Period | 1 Hour (H1) 2009.11.03 02:00 - 2009.11.27 22:00 (2009.11.01 - 2009.11.30) | ||||
| Model | Every tick (the most precise method based on all available least timeframes) | ||||
| Parameters | MagicNumber=0; SignalMail=false; EachTickMode=false; Lots=1; Slippage=3; UseStopLoss=false; StopLoss=30; UseTakeProfit=false; TakeProfit=30; UseTrailingStop=false; TrailingStop=30; | ||||
| Bars in test | 551 | Ticks modelled | 541880 | Modelling quality | n/a |
| Mismatched charts errors | 113 | ||||
| Initial deposit | 10000.00 | ||||
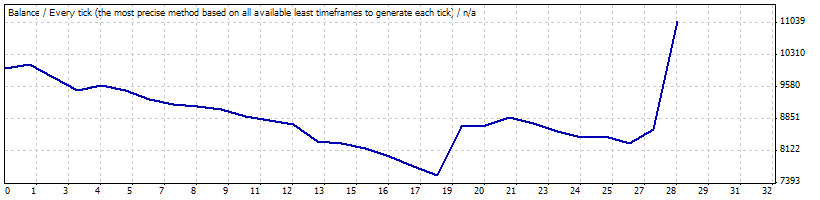
| Total net profit | 1075.72 | Gross profit | 4339.40 | Gross loss | -3263.68 |
| Profit factor | 1.33 | Expected payoff | 38.42 | ||
| Absolute drawdown | 2469.49 | Maximal drawdown | 2904.47 (27.83%) | Relative drawdown | 27.83% (2904.47) |
| Total trades | 28 | Short positions (won %) | 28 (28.57%) | Long positions (won %) | 0 (0.00%) |
| Profit trades (% of total) | 8 (28.57%) | Loss trades (% of total) | 20 (71.43%) | ||
| Largest | profit trade | 2453.34 | loss trade | -395.02 | |
| Average | profit trade | 542.42 | loss trade | -163.18 | |
| Maximum | consecutive wins (profit in money) | 3 (1320.07) | consecutive losses (loss in money) | 14 (-2037.36) | |
| Maximal | consecutive profit (count of wins) | 2783.20 (2) | consecutive loss (count of losses) | -2037.36 (14) | |
| Average | consecutive wins | 2 | consecutive losses | 5 | |
| # | Time | Type | Order | Size | Price | S / L | T / P | Profit | Balance |
| 1 | 2009.11.03 05:00 | sell | 1 | 1.00 | 90.281 | 0.000 | 0.000 | ||
| 2 | 2009.11.03 15:00 | close | 1 | 1.00 | 90.197 | 0.000 | 0.000 | 93.13 | 10093.13 |
| 3 | 2009.11.04 02:00 | sell | 2 | 1.00 | 90.119 | 0.000 | 0.000 | ||
| 4 | 2009.11.04 07:00 | close | 2 | 1.00 | 90.380 | 0.000 | 0.000 | -288.78 | 9804.35 |
| 5 | 2009.11.04 22:00 | sell | 3 | 1.00 | 90.584 | 0.000 | 0.000 | ||
| 6 | 2009.11.05 00:00 | close | 3 | 1.00 | 90.864 | 0.000 | 0.000 | -310.46 | 9493.89 |
| 7 | 2009.11.05 01:00 | sell | 4 | 1.00 | 90.688 | 0.000 | 0.000 | ||
| 8 | 2009.11.05 15:00 | close | 4 | 1.00 | 90.587 | 0.000 | 0.000 | 111.50 | 9605.39 |
| 9 | 2009.11.06 04:00 | sell | 5 | 1.00 | 90.603 | 0.000 | 0.000 | ||
| 10 | 2009.11.06 05:00 | close | 5 | 1.00 | 90.708 | 0.000 | 0.000 | -115.76 | 9489.63 |
| 11 | 2009.11.06 08:00 | sell | 6 | 1.00 | 90.510 | 0.000 | 0.000 | ||
| 12 | 2009.11.06 13:00 | close | 6 | 1.00 | 90.691 | 0.000 | 0.000 | -199.58 | 9290.05 |
| 13 | 2009.11.06 15:00 | sell | 7 | 1.00 | 90.120 | 0.000 | 0.000 | ||
| 14 | 2009.11.09 04:00 | close | 7 | 1.00 | 90.212 | 0.000 | 0.000 | -102.75 | 9187.30 |
| 15 | 2009.11.09 06:00 | sell | 8 | 1.00 | 90.102 | 0.000 | 0.000 | ||
| 16 | 2009.11.09 07:00 | close | 8 | 1.00 | 90.143 | 0.000 | 0.000 | -45.48 | 9141.82 |
| 17 | 2009.11.09 08:00 | sell | 9 | 1.00 | 90.063 | 0.000 | 0.000 | ||
| 18 | 2009.11.09 09:00 | close | 9 | 1.00 | 90.125 | 0.000 | 0.000 | -68.79 | 9073.03 |
| 19 | 2009.11.09 12:00 | sell | 10 | 1.00 | 89.877 | 0.000 | 0.000 | ||
| 20 | 2009.11.09 19:00 | close | 10 | 1.00 | 90.019 | 0.000 | 0.000 | -157.74 | 8915.29 |
| 21 | 2009.11.09 23:00 | sell | 11 | 1.00 | 89.908 | 0.000 | 0.000 | ||
| 22 | 2009.11.10 02:00 | close | 11 | 1.00 | 89.994 | 0.000 | 0.000 | -96.33 | 8818.96 |
| 23 | 2009.11.10 05:00 | sell | 12 | 1.00 | 89.899 | 0.000 | 0.000 | ||
| 24 | 2009.11.10 06:00 | close | 12 | 1.00 | 89.979 | 0.000 | 0.000 | -88.91 | 8730.05 |
| 25 | 2009.11.10 07:00 | sell | 13 | 1.00 | 89.766 | 0.000 | 0.000 | ||
| 26 | 2009.11.10 12:00 | close | 13 | 1.00 | 90.122 | 0.000 | 0.000 | -395.02 | 8335.03 |
| 27 | 2009.11.10 15:00 | sell | 14 | 1.00 | 89.788 | 0.000 | 0.000 | ||
| 28 | 2009.11.11 08:00 | close | 14 | 1.00 | 89.823 | 0.000 | 0.000 | -39.74 | 8295.29 |
| 29 | 2009.11.11 22:00 | sell | 15 | 1.00 | 89.805 | 0.000 | 0.000 | ||
| 30 | 2009.11.11 23:00 | close | 15 | 1.00 | 89.900 | 0.000 | 0.000 | -105.67 | 8189.62 |
| 31 | 2009.11.12 03:00 | sell | 16 | 1.00 | 89.715 | 0.000 | 0.000 | ||
| 32 | 2009.11.12 08:00 | close | 16 | 1.00 | 89.890 | 0.000 | 0.000 | -194.68 | 7994.94 |
| 33 | 2009.11.12 09:00 | sell | 17 | 1.00 | 89.795 | 0.000 | 0.000 | ||
| 34 | 2009.11.12 14:00 | close | 17 | 1.00 | 89.998 | 0.000 | 0.000 | -225.56 | 7769.38 |
| 35 | 2009.11.13 04:00 | sell | 18 | 1.00 | 90.209 | 0.000 | 0.000 | ||
| 36 | 2009.11.13 08:00 | close | 18 | 1.00 | 90.391 | 0.000 | 0.000 | -201.35 | 7568.03 |
| 37 | 2009.11.13 10:00 | sell | 19 | 1.00 | 90.156 | 0.000 | 0.000 | ||
| 38 | 2009.11.17 13:00 | close | 19 | 1.00 | 89.155 | 0.000 | 0.000 | 1121.22 | 8689.25 |
| 39 | 2009.11.18 05:00 | sell | 20 | 1.00 | 89.232 | 0.000 | 0.000 | ||
| 40 | 2009.11.18 15:00 | close | 20 | 1.00 | 89.225 | 0.000 | 0.000 | 7.85 | 8697.10 |
| 41 | 2009.11.19 03:00 | sell | 21 | 1.00 | 89.175 | 0.000 | 0.000 | ||
| 42 | 2009.11.19 21:00 | close | 21 | 1.00 | 89.005 | 0.000 | 0.000 | 191.00 | 8888.10 |
| 43 | 2009.11.20 01:00 | sell | 22 | 1.00 | 88.910 | 0.000 | 0.000 | ||
| 44 | 2009.11.20 02:00 | close | 22 | 1.00 | 89.035 | 0.000 | 0.000 | -140.39 | 8747.71 |
| 45 | 2009.11.20 04:00 | sell | 23 | 1.00 | 88.823 | 0.000 | 0.000 | ||
| 46 | 2009.11.20 14:00 | close | 23 | 1.00 | 88.980 | 0.000 | 0.000 | -176.44 | 8571.27 |
| 47 | 2009.11.23 00:00 | sell | 24 | 1.00 | 88.818 | 0.000 | 0.000 | ||
| 48 | 2009.11.23 03:00 | close | 24 | 1.00 | 88.943 | 0.000 | 0.000 | -140.54 | 8430.73 |
| 49 | 2009.11.23 04:00 | sell | 25 | 1.00 | 88.913 | 0.000 | 0.000 | ||
| 50 | 2009.11.23 11:00 | close | 25 | 1.00 | 88.885 | 0.000 | 0.000 | 31.50 | 8462.23 |
| 51 | 2009.11.23 12:00 | sell | 26 | 1.00 | 88.823 | 0.000 | 0.000 | ||
| 52 | 2009.11.23 17:00 | close | 26 | 1.00 | 88.974 | 0.000 | 0.000 | -169.71 | 8292.52 |
| 53 | 2009.11.24 01:00 | sell | 27 | 1.00 | 88.911 | 0.000 | 0.000 | ||
| 54 | 2009.11.25 01:00 | close | 27 | 1.00 | 88.618 | 0.000 | 0.000 | 329.86 | 8622.38 |
| 55 | 2009.11.25 02:00 | sell | 28 | 1.00 | 88.466 | 0.000 | 0.000 | ||
| 56 | 2009.11.27 10:00 | close | 28 | 1.00 | 86.345 | 0.000 | 0.000 | 2453.34 | 11075.72 |